U.S. government spending in relation to tax receipts
Editor
In one of his informative blogs [1] Professor Bill Mitchell brought to the attention of his readers some interesting U.S. economic statistics, namely, the detailed historical records of fiscal aggregates produced by the federal Office of Management and Budget.
In particular, from numbers displayed in the Summary of Receipts, Outlays, and Surpluses or Deficits: 1789 to 2019, one can obtain a good graphical portrayal of what has happened over a very long period of historical time. Bill Mitchell commented on the significance of this graph as follows:
“ Here is a graph of the difference between cumulative [federal] tax revenue and cumulative federal spending in the U.S. since 1789.
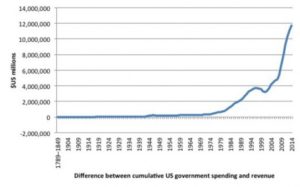 “ The US started to run fiscal deficits systematically in 1931 and since then has run deficits 85 per cent of the time. Every time they had tried to run surpluses a recession has followed.
“ Note the gap widens after the early 1970s, which of course is when the Bretton Woods system of convertible currencies and fixed exchange rates was abandoned and the U.S. government adopted a fiat currency system.
“ It seems that public spending has not been paid for by taxes over a long period of time. Funny about that! “
Source: Bill Mitchell – billy blog, 19 Dec 2014
Reference [1] http://bilbo.economicoutlook.net/blog/?p=29761