U.S. Economic trends, ten years after the crash – David Ruccio
“… ten years on, U.S. capitalism has created the conditions for renewed instability and another, dramatic crash.”
The economic crises that came to a head in 2008 and the massive response – by the U.S. government and corporations themselves – reshaped the world we live in.* Although sectors of the U.S. economy are still in one of their longest expansions, most people recognize that the recovery has been profoundly uneven and the economic gains have not been fairly distributed.
The question is, what has changed — and, equally significant, what hasn’t — during the past decade?
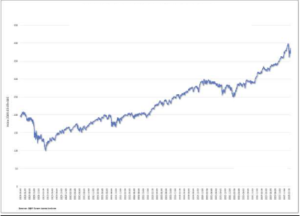
Let’s start with the U.S. stock markets, which over the course of less than 18 months, from October 2007 to March 2009, dropped by more than half. And since then? As is clear from the chart (Fig 1), stocks (as measured by the Dow Jones Composite Average) have rebounded spectacularly, quadrupling in value (until the most recent sell-off).
One of the reasons behind the extraordinary bull market has been monetary policy, which through normal means and extraordinary measures has transferred debt and put a great deal of inexpensive money in the hands of banks, corporations, and wealth investors.
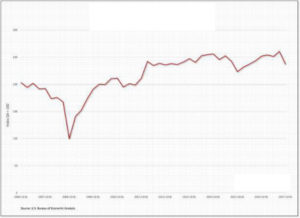
The other major reason is that corporate profits have recovered, also in spectacular fashion. As illustrated in Fig 2, corporate profits (before tax, without adjustments) have climbed almost 250 percent from their low in the 3rd quarter of 2008. Profits are, of course, a signal to investors that their stocks will likely rise in value. Moreover, increased profits allow corporations themselves to buy back a portion of their stocks.
Finally, wealthy individuals, who have managed to capture a large share of the growing surplus appropriated by corporations, have acquired a growing mountain of cash for speculating on stocks.
Clearly, the United States has experienced a profit-led recovery during the past decade, which is both a cause and a consequence of the stock-market bubble.
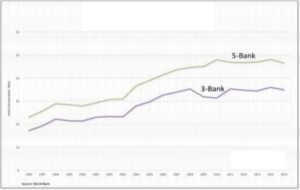
The economic crash and the second Great Depression, characterized by the much-publicized failures of large financial institutions such as Bear Stearns and Lehman Brothers, raised a number of concerns about the rise in U.S. bank asset concentration that started in the 1990s. Today, as can be seen in Fig 3, those concentration ratios (the 3-bank ratio and the 5-bank ratio) are even higher.
The top three are JPMorgan Chase (which acquired Bear Stearns and Washington Mutual), Bank of America (which purchased Merrill Lynch), and Wells Fargo (which acquired Wachovia, North Coast Surety Insurance Services, and Merlin Securities), followed by the Citigroup (which managed to survive both a partial nationalization and a series of failed stress tests), and then Goldman Sachs (which managed to borrow heavily, on the order of $782 billion in 2008 and 2009, from the Federal Reserve).
At the end of 2015 (the last year for which data are available), the 5 largest “Too Big to Fail” banks held 46.5% of the total of U.S. bank assets.
Moreover, in the Trump administration as in the previous two, the revolving door between Wall Street and the entities in the federal government that are supposed to regulate Wall Street (Fig 4) continues to spin. And spin. And spin.
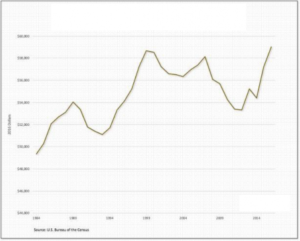
As for everyone else, they’ve barely seen a recovery. Real median house- hold income in 2016 was only 1.5 percent higher than it was before the crash, in 2007 (Fig 5)..
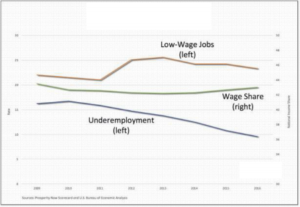
That’s because, even though the under- employment rate (the annual average rate of unemployed workers, marginally attached workers, and workers employ- ed part-time for economic reasons as a percentage of the civilian labor force plus marginally attached workers, the lower line in Fig 6) has fallen in the past ten years, it is still very high — 9.6% in 2016. In addition, the share of low-wage jobs (the percentage of jobs in occupat- ions with median annual pay below the poverty threshold for a family of four, the upper line) remains stubbornly elev- ated (at 23.3%) and the wage share of national income (the middle line) is still less than what it was in 2009 (at 43% – and far below its post-war high (of 50.9%, in 1969).
Clearly, the recovery that corporations, Wall Street, and owners of stocks have engineered and enjoyed during the past 10 years has largely bypassed American workers.
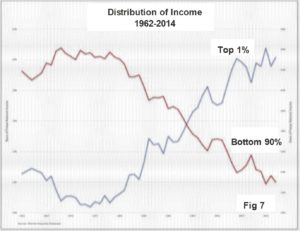
One of the consequences of the lop- sided recovery is that the distribution of income — already obscenely unequal prior to the crash — has continued to worsen (Fig 7). By 2014 (the last year for which data are available), the share of pre-tax national income going to the top 1% had risen to 20.2% (from 19.9% in 2007), while that of the bottom 90% had fallen to 53% (from 54.2% in 2007).
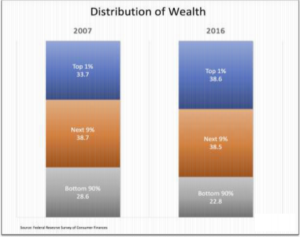
In other words, the rising income share of the top 1% mirrors the declining share of the bottom 90% of the distribution. The distribution of wealth in the U.S. is even more unequal (Fig 8). The top 1% held 38.6% of total household wealth in 2016, up from 33.7% in 2007, that of the next 9% more or less stable at 38.5%, while that of the bottom 90% had shrunk even further, from 28.6% to 22.8%.
So, back to my original question: what has — and has not — changed over the course of the past decade?
One area of the economy has clearly rebounded. Through their own efforts and with considerable help from the government, the stock market, corporate profits, Wall Street, and the income and wealth of the top 1% have all recovered from the crash. It’s certainly been their kind of recovery.
And they’ve recovered in large part because everyone else has been left behind. The vast majority of people, the U.S. working-class, those who produce but don’t gain the surplus: they’ve been forced, within desperate and distressed circumstances, to shoulder the burden of a recovery they’ve had no say in directing and from which they’ve been mostly excluded.
The problem is, that makes the current recovery no different from the run-up to the crash itself — grotesque levels of inequality that fuelled the bloated profits on both Main Street and Wall Street along with a series of speculative asset bubbles. And the current recovery, far from correcting those tendencies, has made them even more obscene.
Thus, ten years on, U.S. capitalism has created the conditions for renewed instability and another, dramatic crash.
Source: Real World Econ Rev, 11 Apr 20018; https://rwer.wordpress.com/2018/04/11/ten-years-after-the-crash-8-charts/#comment-135318