The fiscal cliff – lessons from the 1930s
Report to US Congress, 6 December 2012 – Steve Keen
The “fiscal cliff” developed because both sides of the House concurred that reducing the growth of government debt was the most important economic policy objective, but they could not agree on a common program to do so. Instead, a program of indiscriminate spending cuts and tax concession abolitions was passed, as a “Sword of Damocles” that would drop on America’s collective head if Congress could not reach a compromise by the end of 2012. So unless a deal is bartered by December 31st a set of tax increases and across‐the‐ board cuts in government expenditure will reduce net government spending by about $500 billion, or roughly three per cent of GDP.
What will the consequences be? As Mark Twain once observed, “The art of prophecy is very difficult, especially about the future”, but it’s fair to say that both Democrats and Republicans now fear what this future might be. The fantasy that reducing the government deficit might actually stimulate the economy has clearly been abandoned, in the light of the tragic results of austerity programs in Europe. But both parties can see no other way to achieve their shared overarching objective of reducing government debt.
Pardon me for questioning bipartisanship in this fractious age, but it’s quite possible that the one thing Democrats and Republicans can agree on – that reducing government debt is the number one economic objective – is a mistake. A close look at the empirical data from America’s last great financial crisis – the Great Depression – implies that reducing government debt now may hurt the private sector far more than it helps it, and may also throw America back into recession.
My starting point is an empirically based approach to macroeconomics which concludes that aggregate demand in a monetary economy is the sum of income plus the change in debt. I won’t go into the mathematics of this argument here; instead, I’ll show how this perspective explains why both the Great Depression and our current economic crisis occurred. It also implies that the fiscal cliff could tip the USA back into recession, while doing precious little to reduce government debt as a percentage of GDP.
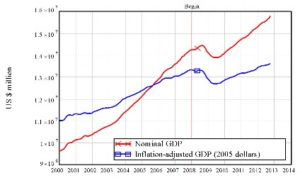
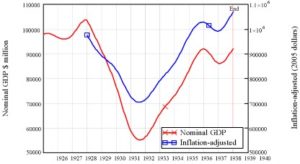
Firstly, let’s look at the recession as most economists do, by considering just GDP. Figure 1 shows both nominal and inflation adjusted GDP (The marker “Begin” shows the start of the recession). Notice that nominal GDP continued to grow for about 6 months after the official start of the recession, while inflation adjusted (or “real”) GDP flatlined for about six months before it started to fall.
Notice also that while GDP certainly fell, it doesn’t look like a lot of a drop – certainly not when compared to the Great Depression. So why was it described as “the biggest crisis since the Great Depression”?
Fig 1: GDP in current dollars and adjusted for inflation (2005 dollars)
Nominal and Inflation-adjusted GDP
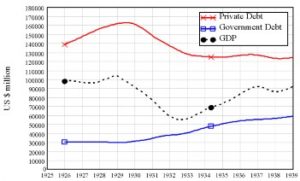
[su_spacer size=”10″]Fig 2: Aggregate US debt levels and GDP
USA debt levels and nominal GDP
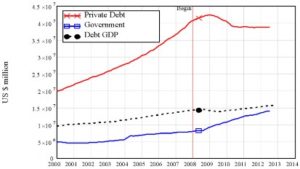
Here’s where debt comes in. We all know that debt played a big role in the crisis, so, let’s get some perspective on it—both private and public debt. Which do you think is bigger – private sector debt, or public sector debt? With all the hullabaloo about how public debt is imposing a burden on our children, you’d be forgiven for nominating public debt as the bigger of the two.
You’d be wrong: even after the growth of public debt and deleveraging by the private sector in the last five years, public sector debt is still less than 40 per cent of the level of private debt, as Figure 2 shows.
Notice also that private debt rose at an accelerating rate from 2000 until it peaked in 2009, and then fell sharply, after which it flatlined from 2010 on. In contrast, government debt flatlined across 2000‐2004, rose slowly in 2004‐2008, and only took off in mid 2008 – at the same time as the decline in GDP began.
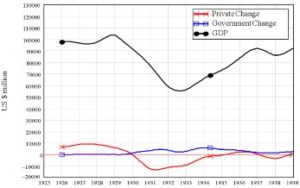
Fig 3: Annual change in debt and the level of GDP
Annual change in debt and nominal GDP
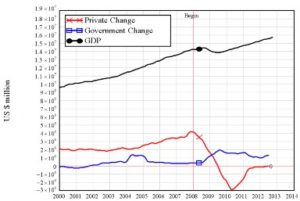
Let’s look at the same data from the point of view of GDP and the change in debt. Figure 3 shows GDP and the annual change in both private and government debt, and it highlights several important points.
- Firstly, the growth of private debt every year from 2000 to 2009 was higher than the highest growth of public debt. In 2008, private debt grew by over$4 trillion (when GDP was just over $14 trillion). Government debt rose by $2 trillion in 2009, which is a lot. But it was no more than the annual growth in private debt in every year from 2000 till 2009, and less than half the peak level of growth of private debt.
- Secondly, the recession began when the rate of increase of private debt peaked and began to fall.
- Thirdly, the “fiscal crisis” – the sudden rapid increase in government deficit – didn’t start until six months after the economic crisis began, when nominal GDP also began to fall.
Already, these observations imply that the change in the behavior of private debt played a key role in the crisis, and that the increase in government spending was a reaction to the downturn in the real economy.
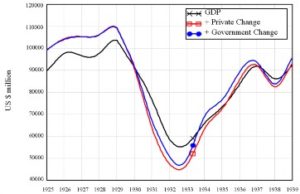
Figure 4 brings this data together in the context of my argument that the change in debt adds to aggregate demand. The black line in Figure 4 shows GDP alone; the red line shows GDP plus the change in private debt only; the blue line shows GDP plus the change in both private and government debt.
Now I think you can see both the timing and the severity of the crisis. The decline in private sector aggregate demand (the sum of GDP plus the change in private debt) was huge. It peaked at $18.4 trillion at the beginning of 2008 and then plunged to $11.1 trillion by early 2010—a fall of 38 per cent that caused unemployment to explode and asset markets to collapse (see Figs 5 and 6).
Fig 4: GDP plus change in debt from 2000 until today
Aggregate demand 2000 until now
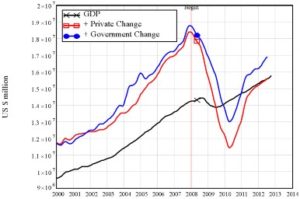
The change in government sector debt cushioned the blow of this dramatic private sector collapse. Total aggregate demand in 2008 (the sum of GDP plus the change in both private and government debt) peaked at $18.8 trillion, and fell to $13 trillion – a 31 per cent fall in total demand. This is still a huge fall – greater than anything experienced since the Great Depression – but substantially less than the fall in private sector demand alone.
Since the depths of the crisis in 2010, the private sector has largely stopped deleveraging: private debt is neither rising nor falling, so that the change in private sector debt is having no overall impact on aggregate demand. But public debt, which is still rising, is adding over $1 trillion to spending in the economy at present. Without the public sector deficit right now, total cash flow in the economy would be roughly $15.5 trillion; because of the public sector deficit, total spending is closer to $17 trillion.
Fig 5: The causal link between change in debt and unemployment

Change in debt and employment
The impact of the collapse in the growth of private debt was immense: it caused both the explosion in unemployment and the collapse of asset markets. Figure 5 shows the correlation between change in debt and unemployment: the rise in unemployment in 2008 coincided with the turnaround from growing to shrinking private debt. Then the strengthening of the recovery in 2010 coincided with a slowdown in the rate of decline of private debt. The correlation between the change in private debt and the level of unemployment is ‐0.94: rising private debt causes falling unemployment.
That’s not to say that rising private debt is a good thing – far from it. A certain level of debt‐financed growth is good, when that debt helps corporations invest in new products and technologies. But the dependence the US economy developed upon debt‐financed growth far exceeded this good level.
What about the relationship between change in government debt and unemployment? That’s the opposite of the private sector debt to unemployment relation: while rising private debt is correlated with falling unemployment, rising government debt is associated with rising unemployment: the correlation coefficient is a positive 0.81.
How can we make sense of this? Here it’s obvious that government debt is responding to changes in the real economy: a rising level of unemployment means rising welfare payments and falling tax revenue. So rising unemployment causes rising government debt. The causal link runs from the real economy to government spending – at least when we’re talking about spending that the government has little control over.
Since this rising debt adds cash flow to the economy, it also helps preserve some private sector employment: people receiving unemployment benefits go shopping at Wal‐Mart and keep some of those private sector workers in employment. Without that debt‐financed government spending, private sector unemployment could have risen a lot more than it actually did – a point I’ll make later in comparing our crisis to the Great Depression.
Change in debt and asset markets
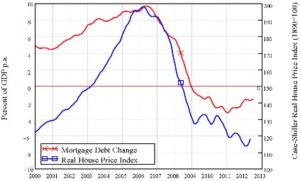
Asset markets display what engineers would call a “positive feedback loop” between asset prices and the change in debt: rising debt causes rising asset prices, and rising asset prices encourage more people to borrow to speculate. Such processes always break down—which is why real engineers take great care to eliminate or control positive feedback processes in systems like cars, rockets and even bridges. Unfortunately, “financial engineers” delight in amplifying these destructive positive feedback loops in the financial system, by supporting deregulation and inventing derivatives.
Figure 6 shows the impact of rising and then falling mortgage debt on house prices. The growth in house prices from 2000 until 2006 was driven by rising mortgage debt, the collapse in prices was triggered by the collapse in mortgage debt, and the recent recovery in house prices coincides with a slowdown in the rate of deleveraging by the household sector. The correlation coefficient here is 0.81.
Fig 6: Change in mortgage debt and house prices
House prices & change in mortgage debt
Of course, the government can also make discretionary changes in its own spending. It can boost spending as with the original response to the crisis in 2008, or it can cut spending as will happen if the fiscal cliff actually comes to pass, and as has been happening in Europe with austerity programs. The important question now, as we approach the fiscal cliff, is what impact will this have on the economy?
There is also the counter‐factual issue of what would have happened to private sector aggregate demand if the government had not “stepped into the breach” with the massive increase in its deficit back in 2008. Clearly the private sector has stopped deleveraging now: would it have done so if the government had done nothing – either by keeping its deficit constant (as it was roughly doing until mid‐2008), or by actively trying to run a surplus? We can get some inkling on both these issues by looking back at the Great Depression.
Aggregate demand during the Great Depression
The dynamics of private and public debt now and in the 1920s‐1940s are qualitatively identical: a private debt bubble financed the “Roaring Twenties”; this gave way to private sector deleveraging in the 1930s; and public debt rose as the private sector delevered, thus reducing the impact of private sector deleveraging. However the quantitative differences are immense.
Firstly, the decline in real GDP back in the Great Depression was much larger than this time around (Fig 7). It fell 28 per cent from the peak in 1930 to the trough in 1932, versus the five per cent fall from 2008 till June 2009. So either our crisis was much milder than the Great Depression, or something happened this time round to reduce its impact.
Fig 7: Nominal and inflation‐adjusted GDP during the Great Depression
Nominal and inflation-adjusted GDP
The second comparison lets us decide the “smaller crisis” vs “something happened” issue: even though the fall in GDP then was much worse than now, the level of private debt was much lower in the 1920s (compare Fig 8 with Fig 2), and the fall in private sector aggregate demand was greater this time.
Compare Fig 9 with Fig 3: the more than $4 trillion increase in private debt in 2008 added 28 per cent to aggregate demand from GDP alone, while the $3 trillion reduction in private debt in 2010 deducted 21 per cent from it. The comparable figures were a ten per cent boost in 1927 and a 21 percent reduction in 1931.
Fig 8: USA Debt levels and Nominal GDP 1925‐1939
[su_spacer size=”10″]
Fig 9: Nominal GDP and annual change in debt 1926‐1939
So aggregate demand fell from a greater height in our crisis, yet the impact on GDP was much less (compare Figure 10 with Figure 4). Something must have cushioned the blow. One candidate for that something else is the scale of government spending.
The increase in government spending in the Great Depression was slow in coming, and even the “New Deal”, when it ultimately arrived, was relatively anemic compared to the stimulus in 2008‐2010 (again, compare Fig 9 to Fig 3).
Even though the “New Deal” is now a byword for government stimulus programs (and some magnificent public infrastructure was created during it), the monetary stimulus from government spending during the New Deal added nine per cent to private sector demand (the gap between the blue and red lines, divided by the red line). During our crisis, government spending added up to 15 per cent to private sector demand.
But it wasn’t just the government spending itself that rescued the economy more rapidly today: it was the impact of that spending on the private sector’s deleveraging. As Fig 9 shows, the private sector delevered for almost five years during the Great Depression – from 1930 until 1935. This time the private sector deleveraging lasted only two years – from mid‐2009 to mid‐2011 (check Fig 3).
If that government spending hadn’t risen as much as it did, then conceivably the private sector’s deleveraging could have gone on for a lot longer – and this crisis could have been much worse than it was. This brings us to the fiscal cliff – and its forerunner in 1937.
Fig 10: GDP plus change in debt from 1925 to 1939
Aggregate demand 1925 until 1939
The fiscal cliff of 1937
As can be seen in Fig 9 and Fig 11, the Roosevelt government “took its foot off the gas” from 1934 on as GDP started to recover. The government deficit peaked at $5.7 billion (yes, billion) in 1934 and fell to as little as $1.2 billion in 1937, in the belief that the worst was over and it was time to get the government’s finances in order.
Only the worst wasn’t over; it had merely been postponed because the private sector had stopped deleveraging in mid‐1934 – probably in response to extra demand being pumped into the economy via the New Deal. But it started to delever again in 1937, and kept doing it for another two years – probably in response to a drop in demand from the public sector. Unemployment, which had fallen from 25 per cent in 1933 to just over 10 per cent in 1937, rose back to 20 per cent in 1938.
Fig 11: Unemployment and change in debt 1929‐1939
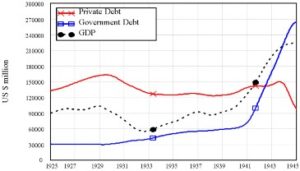
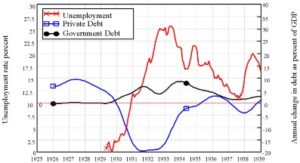 Fig 12: Aggregate US debt levels and GDP 1925-1945
USA debt levels and nominal GDP
Escaping the Great Depression
Nominal GDP only began to recover strongly in 1940, when firstly private debt and then government debt began to rise far more rapidly – as a consequence of the War in Europe (see Fig 12). Government debt finally exceeded GDP, and deficit‐spending, not austerity, led the USA out of the Great Depression. From 1936 until 1938 the government deficit virtually disappeared – and so too did the economic recovery. It only came back in earnest when the government threw fiscal caution to the wind, and geared up for the approaching conflict of WWII.
Fig 13: Annual change in debt and GDP 1925‐1945
Annual change in debt and nominal GDP
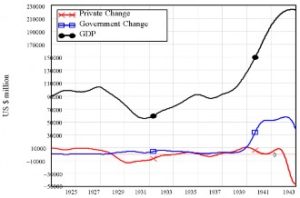
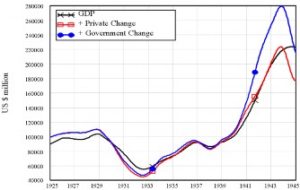
Fig 14: GDP plus the changes in debt 1925‐1945
Annual change in debt and nominal GDP
As the end of WWII approached, rising public debt was such a large contributor to aggregate demand that the private sector was able to reduce its debt dramatically – far more so than during the worst of the Great Depression – with only a small impact on GDP (see Fig 13). The public sector was able to easily reduce its debt levels in the booming economy of the early post‐War years. Unfortunately, over time the financial sector returned to the behavior that causes the Roaring Twenties bubble. Over the next 60 years, private sector debt rose from 45 per cent of GDP to 303 per cent in 2009. The comparable figure at the end of 1930 was 175 per cent of GDP.
Figure 14 puts the entire story together in terms of the contributors to aggregate demand between the Roaring Twenties and the end of WWII (and compare this to Fig 4, to see how early is the current process of deleveraging – from a level of private sector debt that should never have been allowed to accumulate in the first place).
Firstly, private sector debt drove the Roaring Twenties – and yet even though that age is now a by‐word for speculative excess, it had nothing on the period from 2000 until 2007. Secondly, the initial government sector response to the crisis was anemic compared to today’s enormous stimulus. It wasn’t until 1933 that the government deficit more than counteracted private sector deleveraging. Thirdly, the economy slumped again when the government’s premature attempt to rein in its own spending triggered a further bout of private sector deleveraging in 1937‐39. Finally, only a “caution to the winds” level of government spending during WWII boosted aggregate demand and allowed the private sector to complete its deleveraging with a minimal impact on GDP.
This debt‐focused analysis of the economy, and the history of the Great Depression, implies that the fiscal cliff could trigger a renewed period of private sector deleveraging that would put the economy back into a recession driven by falling private sector aggregate demand. There are therefore very good reasons to avoid the fiscal cliff, and to alter the public discourse on debt so that it focuses on the dominant problem, which is the private debt bubble that caused this crisis in the first place.
Takeaway points
- Private debt and government debt are independent, but affect each other.
- Both boost demand in the economy when they rise, and reduce it when they fall.
- Private debt is more important than public debt because it is so much larger, and it drives the economy whereas government debt reacts to it.
- The crisis was caused by the growth of private debt collapsing.
- Government debt rose because the economy collapsed, and it reduced the severity of the crisis.
- A premature attempt to reduce government debt through “the fiscal cliff” could trigger a renewed bout of deleveraging by the private sector, which couldpush the economy back into a recession.
- For the foreseeable future, the main challenge of public policy will be not reducing government debt, but managing the impact of the much larger “Rock of Damocles” of private debt that hangs over the economy.
Source: http://www.paecon.net/PAEReview/issue62/Keen62.pdf
Prof Steve Keen is attached to the University of Western Sydney and is an ERA patron.