Neoliberalism Doesn’t Work
It doesn’t do what it says it can, and we can prove it – Steven Hail
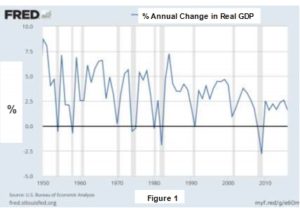
The U.S. economy grew in the 1950s and 60s at an average annual rate of 4.4%; in the 1970s and 80s, at an average rate of 3.2% per annum; in the 1990s and 2000s, on average by 2.5% per year; and since 2010 it has grown by about 2.2% each calendar year.
Now economic growth should not be the be-all and end-all of economic policy, for sure. Growth which continues to destroy our eco-system is not some- thing we can afford in the future.
Moreover, other issues like income and wealth inequality which could possibly, under some circumstances, conflict with the objective of higher growth are also important. This is particularly so, given the evidence that increases in income, beyond a certain point, don’t appear to add much to our sense of subjective well-being, and that by a variety of metrics, successful societies have been shown by social researchers to be more equal and more equitable ones, rather than necessarily those with the highest incomes.
And yet, we have put up with orthodox economists for generations now, and they have been drumming into our heads the following messages:
- Maximising economic growth is the over-riding objective of policy
- Reducing the higher personal tax rates and making the tax system less progressive sharpens incentives for investment and risk taking and raises productivity growth
- Budget surpluses, or at the least balanced budgets, promote economic stability and growth
- A deregulated and bigger financial system promotes economic efficiency and growth
- The best way to promote social well-being is to cut top tax rates, deregulate, financialise, and allow those at the bottom to benefit from the higher growth via a trickle down effect.
A short article such as this is not the place to conduct a thorough scientific assessment of these claims, but let’s attempt to take them seriously, just briefly. And let’s do it for the U.S. only, because after all it is the U.S. which has long been the bastion of trickle down and the rest of the monetarist orthodoxy which took over policy in the 1970s.
Now, go back to the first paragraph, and consider what has happened to U.S. economic growth since the days of Keynesian economic management, full employment and falling inequality of the immediate post-war years. In particular, how did the 70s and 80s compare to the 50s and 60s? OK, the 70s included two oil price shocks, so this might be seen as an unfair comparison. So how did the 90s and 00s compare to the 70s and 80s? OK, the 00s included the Great Recession, so perhaps you see this as unfair. What about 2010-16? Can you see a pattern? By their own metric, the orthodox economists appear to have failed in the U.S. The promises they made back in the 1970s and 80s have not been met.
Perhaps it is easier to see this using a graph (see Figure 1). Here you go, U.S. economic growth since 1950. It’s not going up, up, up, is it? Don’t forget that this might not be your or my objective, but it was the objective of the people who took over economics a generation or two ago.
Now let’s take a quick, and so not very scientific, but honest look at the top marginal rates of income tax in the US. (see Figure 2). I don’t need to give you any figures this time – the chart speaks for itself. Look at the top tax rate in the 50s under Eisenhower, or the 60s and 70s under Nixon. Communists! They make Bernie Sanders look like Milton Friedman. And they make Jeremy Corbyn seem positively Thatcherite by comparison.
It is interesting, isn’t it, that the cuts in the top personal tax rates have been combined not with an acceleration of enterprise and growth, but with the precise opposite. The results have been the opposite of the stated objectives.
 [su_spacer size=”10″]
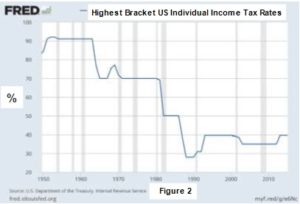 [su_spacer size=”10″]
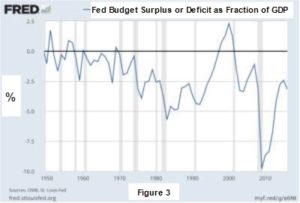
What can we say about the fiscal balance – budget deficits and budget surpluses? See Figure 3.
The first thing to say is that the federal U.S. government, like virtually all other sovereign governments, does not, has not and will not in the future ‘balance the budget’ or run surpluses over time. A balanced budget law would be economic suicide. The U.S. government ran (tiny) surpluses very briefly twice in the 50s and again in the 60s, each time being followed by economic downturns, as you can see in the earlier chart. The only other ‘surplus’ was the Clinton one, which Bill and Hillary and their friends still like to boast about, but which was combined with an unprecedented build up in household debt, and bubbles which burst in both the stock market and then (catastrophically) in the housing market.
The lesson from history, and from basic national income accounting, is that if the private sector overall wishes to add to its savings and if the rest of the world wishes to acquire U.S. dollars (and this became strongly the case after the year 2000, as China and others decided to accumulate large amounts of US dollar reserves) then a fiscal deficit will be necessary if the economy is to remain anywhere close to full employment, without a private debt fuelled bubble taking place. The fiscal deficit after the year 2000 was not large enough to off- set growing trade surpluses of countries like China with the U.S., on which those countries were basing their growth strategies, setting the stage for a crisis.
Remember that the U.S. government cannot ever run out of U.S. dollars, unless it chooses to do so (‘debt ceiling’ anyone?). It is the currency issuer.
They can and almost certainly will run budget deficits nearly all the time for ever (or until there is no longer such a thing as the US government).
What about social well-being? The U.S. has always had a relatively high level of inequality, but as many people have pointed out in recent years, the changes which have taken place there since the 1970s have taken this to a new level, or rather back to an old pre-1930s level. We are back in the Great Gastby, 1925, Scot Fitzgerald, and all that. You want to know were Donald Trump came from? Screwing down ordinary Americans, while brainwashing them with lies about their living in a land of opportunity, and berating complaints as being born out of jealousy, or what we Australians might call the tall poppy syndrome, or worse still – and horror above all horrors – socialism!!!
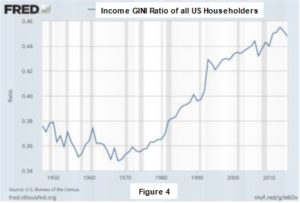 The Gini coefficient is a measure of inequality which lies between 0 and 1, where higher values indicate more inequality. You don’t need to know the details to understand what Figure 4 is telling you (and bear in mind this is for income and not wealth, where the data would be even clearer).
Inequality was continuing to fall some- what, in the golden years up to about 1970, since when it has skyrocketed so that the US now has income inequality typical of a third world country, and not of a civilised and successful society.
We are back in the belle epoque for the rich. Pass the champagne, Donald!
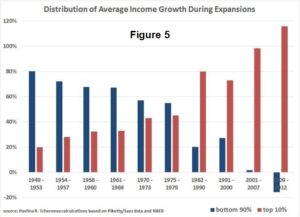
The economist Pavlina Tcherneva has produced a highly informative chart (see Figure 5), which can be accessed on her web page. What it shows you is that until the 1970s most of the income growth during periods of economic expansion went to the bottom 90% of the population: since then, most has gone to the top 10%, and increasing the top 1%. During the period from 2009- 12, under the champion of the elite Barack Obama, so much went to the top 10% that the bottom 90% actually went backwards. The economy was growing, unemployment was falling, but people’s incomes were actually falling. Not much trickle down there!
I could reproduce another U.S. chart to show that hardly any of the very substantial growth in U.S. labour productivity since the early 1970s has gone to U.S. workers in real wages, and consequently nearly all of it has gone to capitalists and investors.
Perhaps it is important to emphasize at this point that this is not a purely U.S. phenomenon. These trends have developed later in countries like Australia, than in the U.S., and in most cases have not gone so far, but we can see a similar story in the Australian data, reproduced in a chart from the blog site of Professor William Mitchell of the University of Newcastle, NSW (see Figure 6).
 [su_spacer size=”10″]
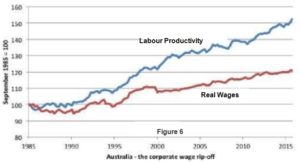
Source: http://bilbo.economicoutlook.net/blog/
And how did that deregulated financial system go? The economist Hyman Minsky, a long time ago, explained that a deregulated financial system would tend to take on more and more risk during times of relative economic stability, and consequently become increasingly fragile, leading to more frequent and more severe financial crises and to eventually a Great Recession. He classified economic management which did not take this tendency into account as ‘inept’.
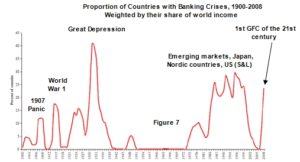
One more chart might be helpful. This is taken from a 2013 paper of two leading orthodox economists, who are hardly radicals – Carmen Reinhart and Kenneth Rogoff (see Figure 7).
The 1950s and 60s are a unique period in global economic history. A period of economic growth, falling inequality in many countries, rising living standards, and virtually nothing which could be described as a banking or financial crisis. And yet, even by the late 60s, Minsky and a few others started to warn of a drift towards fragility and a loosening of the regulations which had allowed this unparalleled period of financial stability to exist. By the end of the last century, almost the whole of the regulatory framework put in place during and after the Great Depression to stop ‘It’ happening again had been dismantled. It seems that the U.S. and the rest of the world wandered ineptly towards the Global Financial Crisis of the previous decade, at least in part through ignoring economists like Hyman Minsky and choosing instead the economics of Milton Friedman and the neoliberals.
What’s more, policy makers, sometimes deliberately and sometimes because they don’t dare face the truth, have in most cases not yet taken in, or taken seriously, any of the above.
To be sure, economic growth for the sake of growth is not what we should aim for – it is indeed ‘the ideology of the cancer cell’, to use the words of Edward Abbey. But there is no evidence that less progressive taxes have promoted growth anyway. There is no evidence that more inequality has contributed towards growth. There is no evidence that deregulation has contributed to growth or to stability or social well- being. There is no credible evidence that trickle-down economics works.
 None whatsoever. It is a fallacy. An article of faith, perhaps – but not of science Almost everything which almost all policy makers have taken for granted and asked us to take for granted for more than a generation has been proved wrong. We were closer to the truth, it seems, in the 1950s and 60s, and there must be some lessons for us there.
Some economists like Mitchell and Tcherneva – whose charts I have reproduced – and some other modern monetary theorists, and politicians like Bernie Sanders and Jeremy Corbyn, have had some success in bringing the above to wider public attention. They don’t advocate a return to the economics of the 1960s, but they and other do advocate an abandonment of the economics and politics of neoliberalism (and of ‘New Labour’ and the ‘Clinton Democrats’), and a shift to a modern progressive, inclusive and equitable approach to economic policy and political decision making.
Dr Steven Hail is a lecturer in economics at Adelaide University, and is an ERA member.