Household Debt: a tale of three countries
Steven Hail

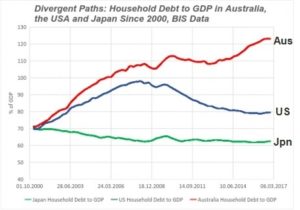
In the year 2000 the countries Japan, USA and Australia all had about the same ratio of household debt to GDP – in each country, this figure was about 70%.
In Japan, the ratio fell gradually from 70% to the low 60%, and has remained at about 62% for a while (see Fig 1).
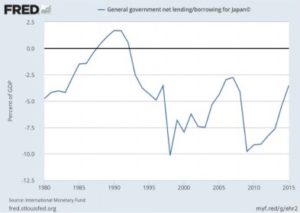
Admittedly Japan has maintained a current account surplus with the rest of the world on its balance of payments, while Australia and the USA have not. But the main reason the Japanese have managed to support their economy and at the same time avoid rising household debt has been a willingness to run government deficits. Over the last ten years, the Japanese fiscal deficit has averaged above 6% of GDP, but going back further, there has been a deficit ever since the Japanese financial crisis of the early 1990s (see Fig 2).
The beneficial role of the deficit, and the irrelevance of its impact on the stock of Japanese government debt, is not generally understood, even in Japan.
Debt and deficit in Japan are not a sign of economic failure – they are the hall- mark of a largely successful attempt to maintain living standards and close to full employment labour market, in an economy where private saving (and especially corporate saving) has out- stripped private investment spending.
It is very important to understand this. Many economists, commentators and credit ratings agencies still don’t under- stand this. They have been vaguely forecasting doom, or at least some kind of financial crisis, for Japan for a couple of decades now. It wasn’t in Japan that the Global Financial Crisis developed. It wasn’t in Japan that the problems of the euro emerged. It isn’t Japan that is faced with dangerous household debt now. These various commentators still do not understand the fiscal space enjoyed by monetary sovereigns like the Japanese government. They don’t understand the appropriate role for the government’s budget in such countries. They look for crises where none will occur. They miss those financial fragilities which drive those crises that do happen. They are very slow to learn. The only thing to do is to ignore them and their advice.
In the US, household debt surged as financial fragility grew, with the ratio peaking at 98% in the first quarter of 2008. Households deleveraged post GFC, and the ratio fell back to about 80%. Still way too high for another surge in private debt to be allowed to persist, but at least well below its level at the peak of the bubble. Substantial government deficits in 2009, 2010 and 2011, and an average deficit of about 5% of GDP has made this possible, while providing enough support for demand to allow for a degree of econ- omic recovery. The US fiscal deficit should have been higher for longer, and is much too low at the moment, but at least the household debt ratio has fallen somewhat.
What about Australia? Like Japan and the US, our household debt to GDP stood at about 70% at the millennium – well above the levels of previous years. It then grew and grew, mainly due to increasing mortgage debt, standing at 108% in mid-2008. Well above the level in the US when the crash happened there.
As we know, Australia missed the worst of the GFC, and propped up its housing market, and household debt just kept growing. By the end of last year it was above 123%, placing Australia very near the top of the global league table.
Bound to lead to a crash? Many would say so — Steve Keen and Philip Soos amongst them — and who am I to disagree? Unwise? On that we should all agree. And done at the urging of successive governments which have failed to run appropriate fiscal policies; with the approval, for most of this period, of the RBA; and with the acquiescence of what until recently was a relaxed APRA.
Who has the debt problem?
Not Japan. Since around 2013, the Bank of Japan began buying up govern- ment debt, to become a monopoly supplier of bank reserves, denominated in Yen.
In September 2016 it took the decision to buy unlimited amounts of Japanese government bonds at a fixed-yield, meaning it could control yields across bond maturities from a two-to-40-year output and sets them at whatever level they choose. It also implemented $80 trillion worth of quantitative and qualit- ative easing while also introducing a negative interest rate of minus 0.1% to current accounts held by financial institutions at the bank, driving the bond yield rate down. Bond market dealers queued up to get their hands on as much Japanese government debt as they could, with the promise it would mature within 40 years.
To quote Economist Bill Mitchell: “The bond markets do not have the power to set yields unless the government allows them that flexibility. The government rules, not the markets.” Moreover, Japan’s government doesn’t need to issue debt in primary markets in order to spend. Because monetary sovereign government debt is not the problem.
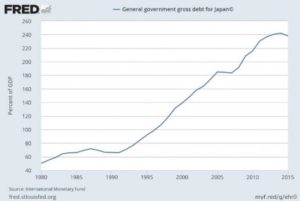
The graph of Japanese government gross debt (see Fig 3) can always be used to scare those who don’t under- stand monetary sovereignty, and the fact that government debt is just non- government saving, but if you under- stand the fiscal space available to governments like those of Japan, the USA and Australia, you know that government debt ratios, taken out of context, are irrelevant. There can be no government debt crisis in these countries. Government debt is better thought of as a form of money, and not debt in the conventional sense at all.
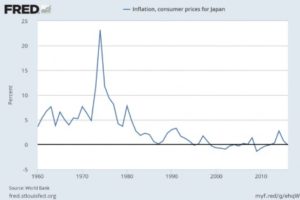
Don’t be intimidated by what appears to be the dizzy heights of government debt in Japan. It is not in itself inflationary (see Fig 4). And in itself it does not imply higher interest rates (see Fig 5). Moreover it has helped to keep Japan close to full employment, when the Japanese private sector has been saving rather than investing (see Fig 6).
And Japan has not done so badly in terms of income per head either. The economy may not have grown rapidly, but the population has been shrinking. In terms of productivity and GDP per capita, Japan has been doing pretty well, given its ageing population.
Australia too has performed relatively well in terms of GDP per capita, but has relied more on household debt and less on government debt. So despite its better demographic prospects, it is Australia which is faced with the debt problem – not Japan.
Household debt is the problem
The Australian government was running a fiscal surplus in the run-up to the Global Financial Crisis, relying on a mix of mining investment and household debt to grow its economy. Even after the crisis, the fiscal deficit was neither large enough nor maintained at a high enough level for long enough, to permit an economic recovery with falling household debt. Instead, successive governments placed their bets on an ever-inflating property market and on a household debt bubble which would never burst.
Australian governments have still not learned what a monetary sovereign government’s fiscal policy should be all about. They still don’t understand that government budget deficits are not really borrowing at all, and that monetary sovereign government debt is not really debt in the conventional sense. They behave as though the government can become insolvent, or otherwise might cause hyperinflation. They are completely wrong.
Who has the debt problem? Australia. and the USA. Because the debt of a monetary sovereign government is not the problem. Household debt is the problem.

Dr Steven Hail is a Lecturer in Economics at Adelaide University, and is an ERA member. His most recent book is Economics for Sustainable Prosperity
Source: This article was originally published in Renegade Inc.
https://renegadeinc.com/a-tale-of-three-countries/
[su_spacer size=”10″] [su_spacer size=”10″][su_spacer size=”10″]