The Global Financial Crisis from a flawed neoclassical perspective
Steve Keen
This is a critique by Steve Keen of Lee Ohanian’s paper “The economic crisis from a neoclassical perspective” – which appeared in J. Economic Perspectives during 2010.
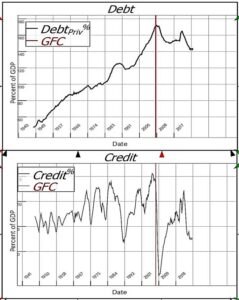
Ohanian dismisses any role for finance in the “Global Financial Crisis”— which probably explains why American neoclassical economists refer to it instead as “The Great Recession”. But Ohanian’s way of dismissing it exposes how little neoclassical economists in general know about finance. He uses the following figure to reject the argument that the GFC was caused by the financial sector:
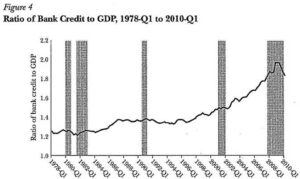
He comments that:
“The financial explanation also argues that the 2007-2009 recession became much worse because of a significant contraction of intermediation services. But some measures of intermediation have not declined substantially.
“Figure 4 … shows that bank credit relative to nominal GDP rose at the end of 2008 to an all-time high. And while this declined by the first quarter of 2010, bank credit was still at a higher level at this point than any time before 2008.6.
“These data suggest that aggregate quantities of intermediation volumes have not declined markedly.”
This would just be funny, if mistakes like this by economists weren’t so consequential. The chart is labelled “credit” in the source data (The Fed’s H8 series), but even a cursory check of the data makes it obvious that this series shows you, not “credit”, but “debt”.
Ohanian’s Figure 4 shows the amount of outstanding debt at any particular time, and not the change in the quantity of debt owed (which is how “credit” is properly defined). Blind Freddie would have noticed this, because, if the numbers in Ohanian’s Figure 4 actually represented “Intermediation Services” — as he called bank lending — then private debt would by now be thousands of billions of times GDP.
Notice the numbers on the Y-axis of Figure 4: the smallest number is 1.0. That would mean that, at the minimum, the rate of growth of private debt was equal to GDP. Therefore, the private debt to GDP ratio would, at the minimum, double every year.
Ohanian’s graph begins in 1978. In 1978, as it happens, the ratio of private debt to GDP (as recorded by the Bank of International Settlements) was roughly 100%. By 2010, if Ohanian’s Figure 4 actually showed credit (“intermediation services” in his words), and “credit” flatlined at the lowest number in his graph (1.0 times GDP), then by 2010, when his graph ends, private debt would have been more than 4 billion times GDP (2 to the power of 32 equals 4,294,967,296).
The fact that Ohanian did not even realise this error shows how little attention he and other neoclassical economists actually pay to financial data. The real numbers for “intermediation services” were not those given in his Figure 4, but the rate of change of those numbers. When the numbers are plotted, it becomes obvious that a collapse in “intermediation services” was responsible for the Global Financial Crisis. Debt peaked at 170% of GDP in 2008 (comparable to the different numbers Ohanian used from The Fed), but credit — the annual change in debt — went from plus 15% of GDP in 2007 to minus 5% in 2009.
It isn’t just Ohanian who is an ignoramus here. This paper was passed for publication by the editors of the Journal of Economic Perspectives, and had at least two referees. Ohanian thanked 19 people for comments on the paper, and these include one “Nobel” prize winner (Ed Prescott). Neoclassical economists in general are ignorant in regard to the monetary system, and the economy in general, and it’s time the whole world became aware of that.
Source: Steve Keen’s Substack Steve Keen from Building a New Economics: [email protected]
Prof Steve Keen is a well-known post-Keynesian economist and author, a distinguished research fellow at UCL, and an ERA patron.
The article is republished with the permission of the author. If you like Steve’s economic analysis then you are invited to support his work by signing up to either of the following networks:
(a) Patreon (https://www.patreon.com/ProfSteveKeen – minimum $10 per year);
(b) Substack (https://profstevekeen. substack.com/ — minimum $5 per month). Also, readers might like to consider applying for Steve Keen’s 7-week online teaching course: “Rebel Economist Challenge”. Every week on live Mastermind Sessions, via https://www.stevekeen.com And as an additional bonus, those who qualify may download some of Steve’s books for free.