Why Europe’s austerity experiment is doomed to fail
Steve Keen
I’ve spent the past two weeks in Europe, with speaking engagements in Italy, Greece and Austria. This was my first visit to Greece, and my first chance to get an admittedly superficial tourist’s view of what a country with Great Depression levels of unemployment looks like.
It didn’t look like anything in particular until the drive from Athens, Greece’s capital & largest city, to Thessaloniki, its second largest. Then it struck me: the roads were near empty — as the toll booth shown in Fig 1 illustrates.
My host Nikos reckons he has done a million kilometers over the years on this 500km drive, and he confirmed that roads which were now virtually empty were once full of cars, and especially trucks — that mobile sign of a thriving economy.
This is a very different manifestation of economic stagnation than the mental picture I had of it from the historical record of the Great Depression, when the overwhelming impression was of crowds: crowds lined up at soup kitchens, crowds outside dole offices. Today, the 28 per cent of Greek’s workforce that is unemployed is mainly at home (if they have homes), and surviving on electronically transmitted dole payments. The social organisation of the unemployed that marked the Great Depression is not apparent today — though the political shifts are beginning.

Parties of both the Left and the Right that are opposed to EU austerity policies made dramatic gains in the recent European elections, and in Greece, if an election were held this week, the mainstream parties that are identified with the Troika’s austerity program would be thrown out of office.
Despite this, the EU bureaucrats who have crafted the “Stability and Growth Pact” and its “reduce public debt at all costs” program are digging in, insist- ing this is the only way for Europe to overcome its economic malaise.
The narrative is that irresponsible government spending led to the crisis, and “fiscal consolidation” — a drastic reduction in the level of public debt thanks to years of budget surpluses — can end it. Greece in particular has been told to run budget surpluses of 4.5 per cent of GDP for the next decade or so, and to have a long- term target of a 4 per cent surplus every year. And Greece has no choice but to shoot for this target, since its budget must be approved by the EU.
So how does this narrative stack up against the facts? Firstly, there’s no doubt that Greece is in a real Great Depression. Twenty-eight per cent of the workforce is unemployed, a staggering figure, since the modern ILO definition of unemployment is much more restrictive than that which was used in the Great Depression to record the USA’s peak level of 25 per cent.
But even on this data, the narrative doesn’t entirely fit the “Greek is a basket case” narrative.
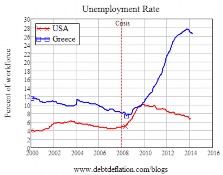
Unemployment in Greece was 8 per cent when the crisis started in 2008, well below the 12 per cent peak in 2000, and it had been trending down (it continued to fall in the early days of the crisis). In the USA, unemployment was higher in 2008 than in 2000, and rose rapidly to reach 10 per cent in late 2009 — the same level as for Greece (see Figure 2). So Greece had been improving over the early 2000s while the USA had been treading water, and the downturn in the USA was much sharper and faster than in Greece.
From then on however, the “basket case” narrative looks convincing: US unemployment started to fall from that date, while Greek unemployment skyrocketed to a staggering peak of 28 per cent in late 2013. So Greece is in a second Great Depression, while America is emerging from a serious crisis, but not something on the scale of the 1930s.
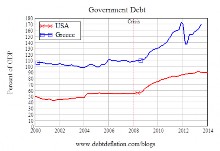
It’s also true that Greece began the crisis with a very high level of public debt: 110 per cent of GDP in 2008, versus half that for the USA (see Figure 3). But there was no trend to Greek public debt before then — it was marginally higher in 2006 than in 2008, and much the same level in 2000. This was true of the US as well. So it’s hard to blame government spending for the false prosperity before the crisis in either country.
Instead, the rise in public debt began after the crisis in both countries — and this occurred earlier in the US than in Greece. The blowout in Greek public debt began in earnest in 2010, two years into the crisis — when government debt in the US had already begun to taper. Its fell sharply in 2012 but is now rising even more sharply, while government debt in the USA is actually falling as a percentage of GDP.
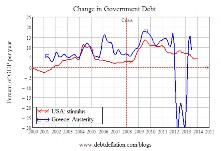
The change in debt data puts some flesh on this picture — and it runs counter to the EU narrative that reining in public debt should be the priority. Frankly, what should the first priority is what works — and the US is the success story here. Did it get its public debt in order first? No way: the rise in public debt in the US began after the crisis, as did Greece’s. The US talked about austerity – with the famous Sequester – but fortunately that was avoided so that the US government never imposed austerity measures. And yet paradoxically – if the EU’s analysis is correct – the US public debt to GDP ratio tapered while Greece’s exploded.
The raw statistics here underplay the drama in public spending in Greece from 2010 onwards, as the economic timeline details, with severe austerity measures being invoked from the end of 2010 (when the level of unemployment also began to skyrocket). So Greece’s post-crisis deficits occurred because revenue fell faster than spending was cut – not because the government was running stimulatory deficits as were the Americans.
Growing government debt thus appears to be more a symptom of the crisis than a cause. Its rise began after the crisis in both countries, not before; and the one that hasn’t deliberately attempted to reduce government spending by austerity is the one whose public debt ratio is no longer rising.
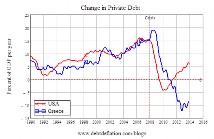
What about my hobby-horse, private debt? Now there’s a story to tell: whereas there was no trend to public debt before the crisis in either country, private debt rose at a rapid rate in both countries – and the USA’s debt level was much higher at 170 per cent of GDP when the crisis began, versus 110 per cent for Greece. After the crisis, US private debt peaked at 175 per cent of GDP, and then fell to just below 160 per cent, while Greek levels have rose another 20 per cent and then flat- lined at about 130 percent.
The change in debt data paints a compelling picture (see Figure 6). The two countries were remarkably similar until 2010: before the crisis, the rate of growth of private debt increased from a low of under 5 per cent of GDP in the early 1990s to a peak of 15 per cent of GDP on the eve of the crisis. Then the plunge in private debt growth began — though earlier in the US, with Greece still booming to a peak of 19 per cent of GDP in 2009. Both then dived from leveraging to deleveraging, with private debt growth turning negative in 2009 in the US and 2011 in Greece.
But in 2010 the US took a distinctly different course: the rate of deleveraging slowed and America smoothly moved towards rising private debt once more. Greece, on the other hand, continued the plunge into negative private debt growth, and since late 2012 private debt in Greece has been falling at a rate of over 10 per cent of GDP per year.
Conventional wisdom thinking on this would see Greece’s example as one of laudable frugality (puzzle: why has this not led to prosperity?) but in our credit-driven world this means a collapse in the means of payment and hence an economic collapse.
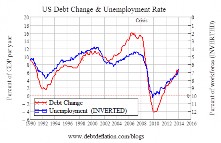
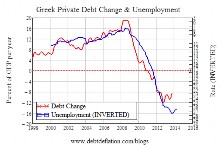
That is borne out by the correlation data between change in private debt and the level of unemployment shown in Figure 7 for the US and Figure 8 for Greece, where I’ve inverted the unemployment scale to make it easier to see the negative correlation — unemployment falls when the rate of change of private debt rises (and no, this isn’t an example of ‘correlation isn’t causation’ spurious correlation).
In the US, the plunge into the Great Recession began when the rate of growth of private debt slowed down in 2008, and the turnaround began in 2010 when the rate of growth of private debt started to rise.
In Greece, on the other hand, it’s been all downhill from late 2008, when unemployment hit a record low
of 7.5 per cent and private debt growth peaked at 19 per cent of GDP per year, right until late 2012 when the rate of deleveraging peaked at – 12 per cent of GDP per year. Since then it’s risen a bit, to about -8 per cent per year, and the rate of unemployment has levelled out at a still staggering 27 per cent of the workforce.
The takeaways from this statistical comparison are that private debt dynamics are what drive the economy, and that public sector austerity fails because it forces the private sector to continue deleveraging. The EU-imposed austerity program is the reason why Greece and Spain are experiencing a Great Depression now, rather than the obvious (if fragile) recovery that is underway in the US. It is a classic own goal by the orthodox-economics- obsessed bureaucrats in Brussels.

Prof Steve Keen is an ERA patron, author of the book Debunking Economics, and of the blogsite Debtwatch, and is chief economist for the Institute of Dynamic Economic Analysis.
Source: Steve Keen’s blogsite http://www.debtdeflation.com/blogs/2014/06/23/why-europes-austerity-experiment-is-doomed-to-fail/